CSIS Hurricane Impact Data Viz
 I developed this data visualization for an article on the impact of hurricanes on regional economies in South America. The visualization was built using highcharts.
The data was generated from the CSIS Americas program, which explores the financial impact of climate change on the Americas in an article about digital transformation in the Americas.
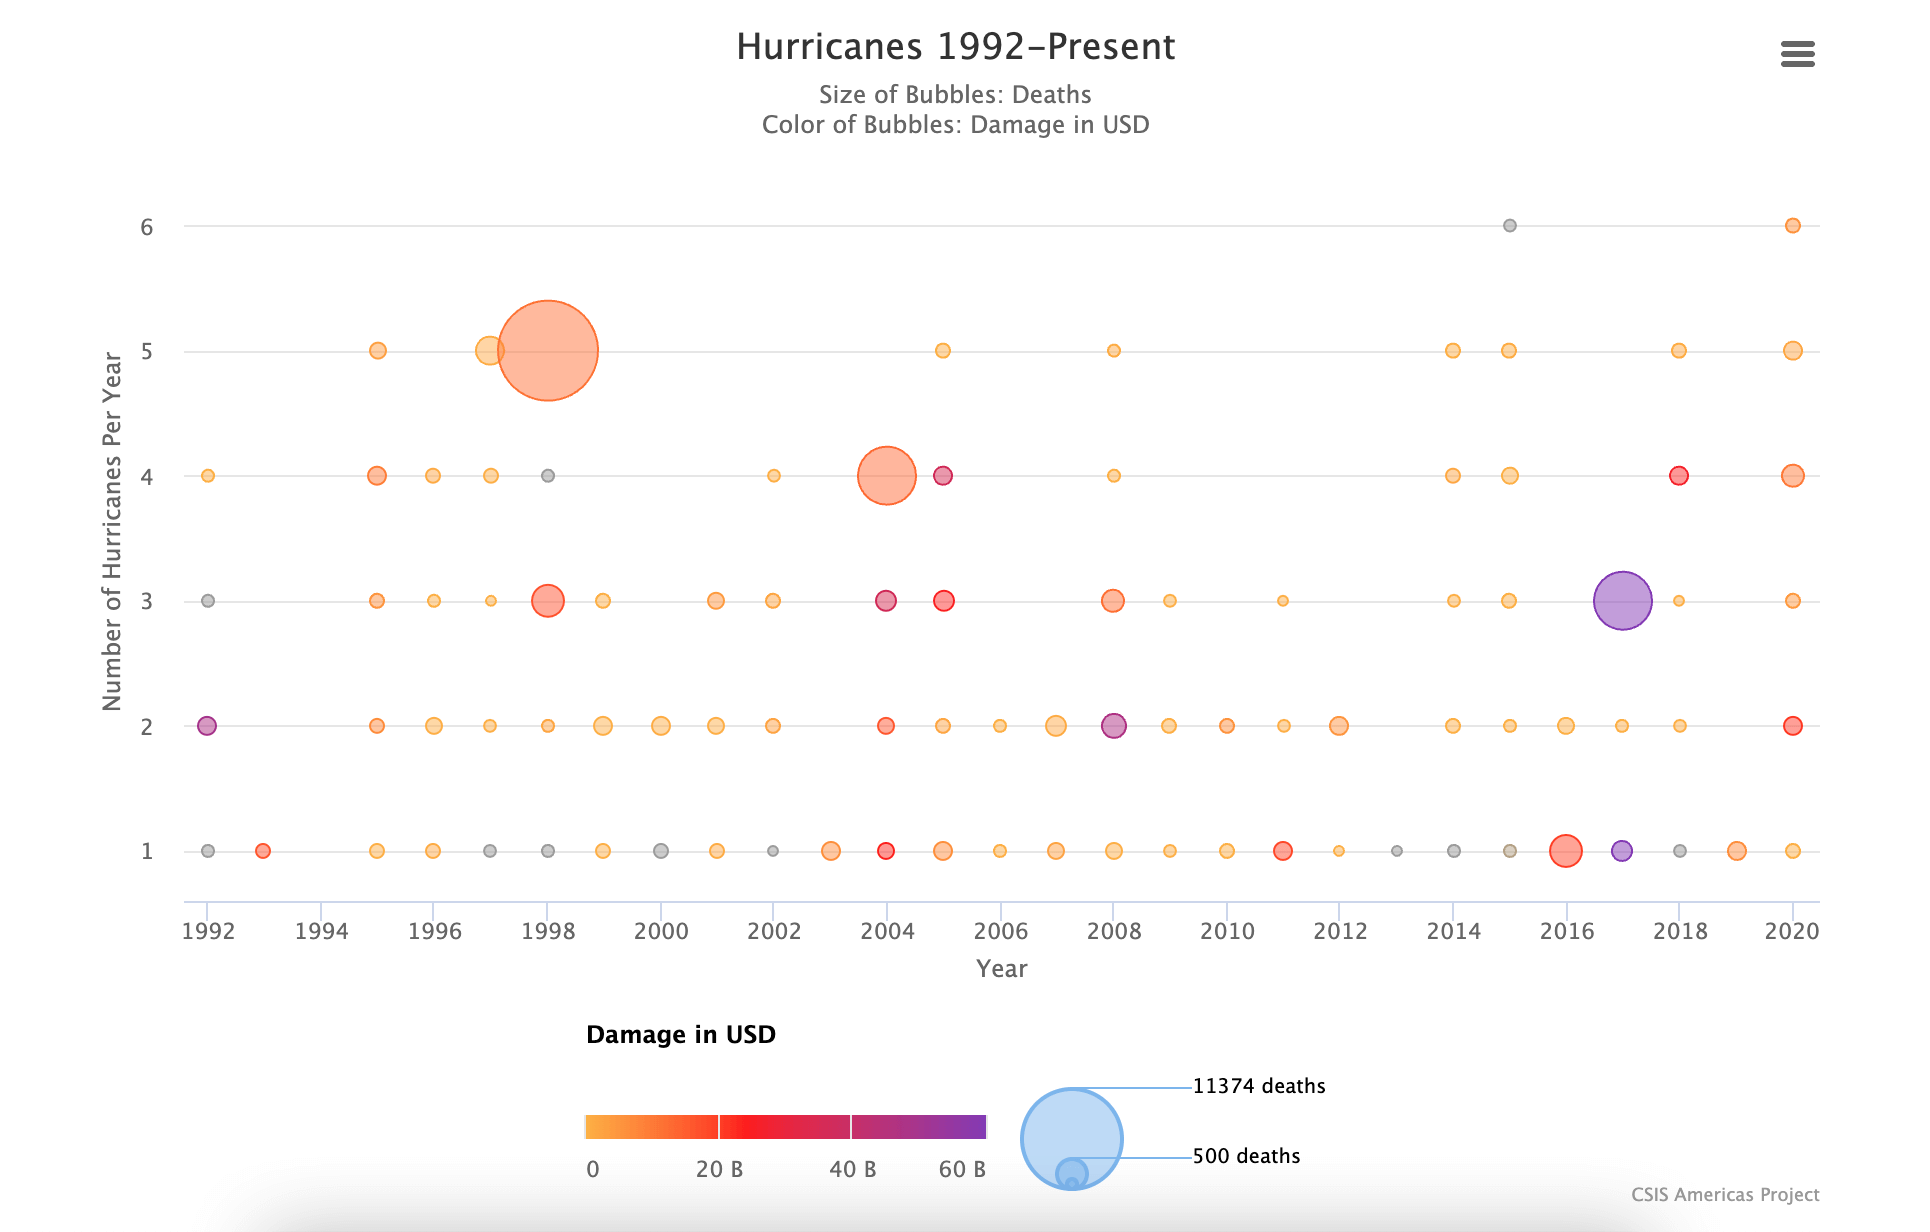
The visualization shows the number of hurricanes per year, the deaths cause by each hurricane, and the economic damage of each hurricane, using circle size, color, and position as variables. sourced from the National Oceanic and Atmospheric Administration (NOAA) and the US Department of Commerce. The visualization shows the number of hurricanes that have hit the US since 1900, the number of deaths and the economic impact of each hurricane.
You can see the rest of the article here: CSIS Americas Article